
We automate your


Stop copying and pasting!
Automate every step, from survey to report. Faster response, with less risk of error.

Focus on the result. Automate routine work
Creating surveys is not difficult. Compiling the results is. There is a smarter way!
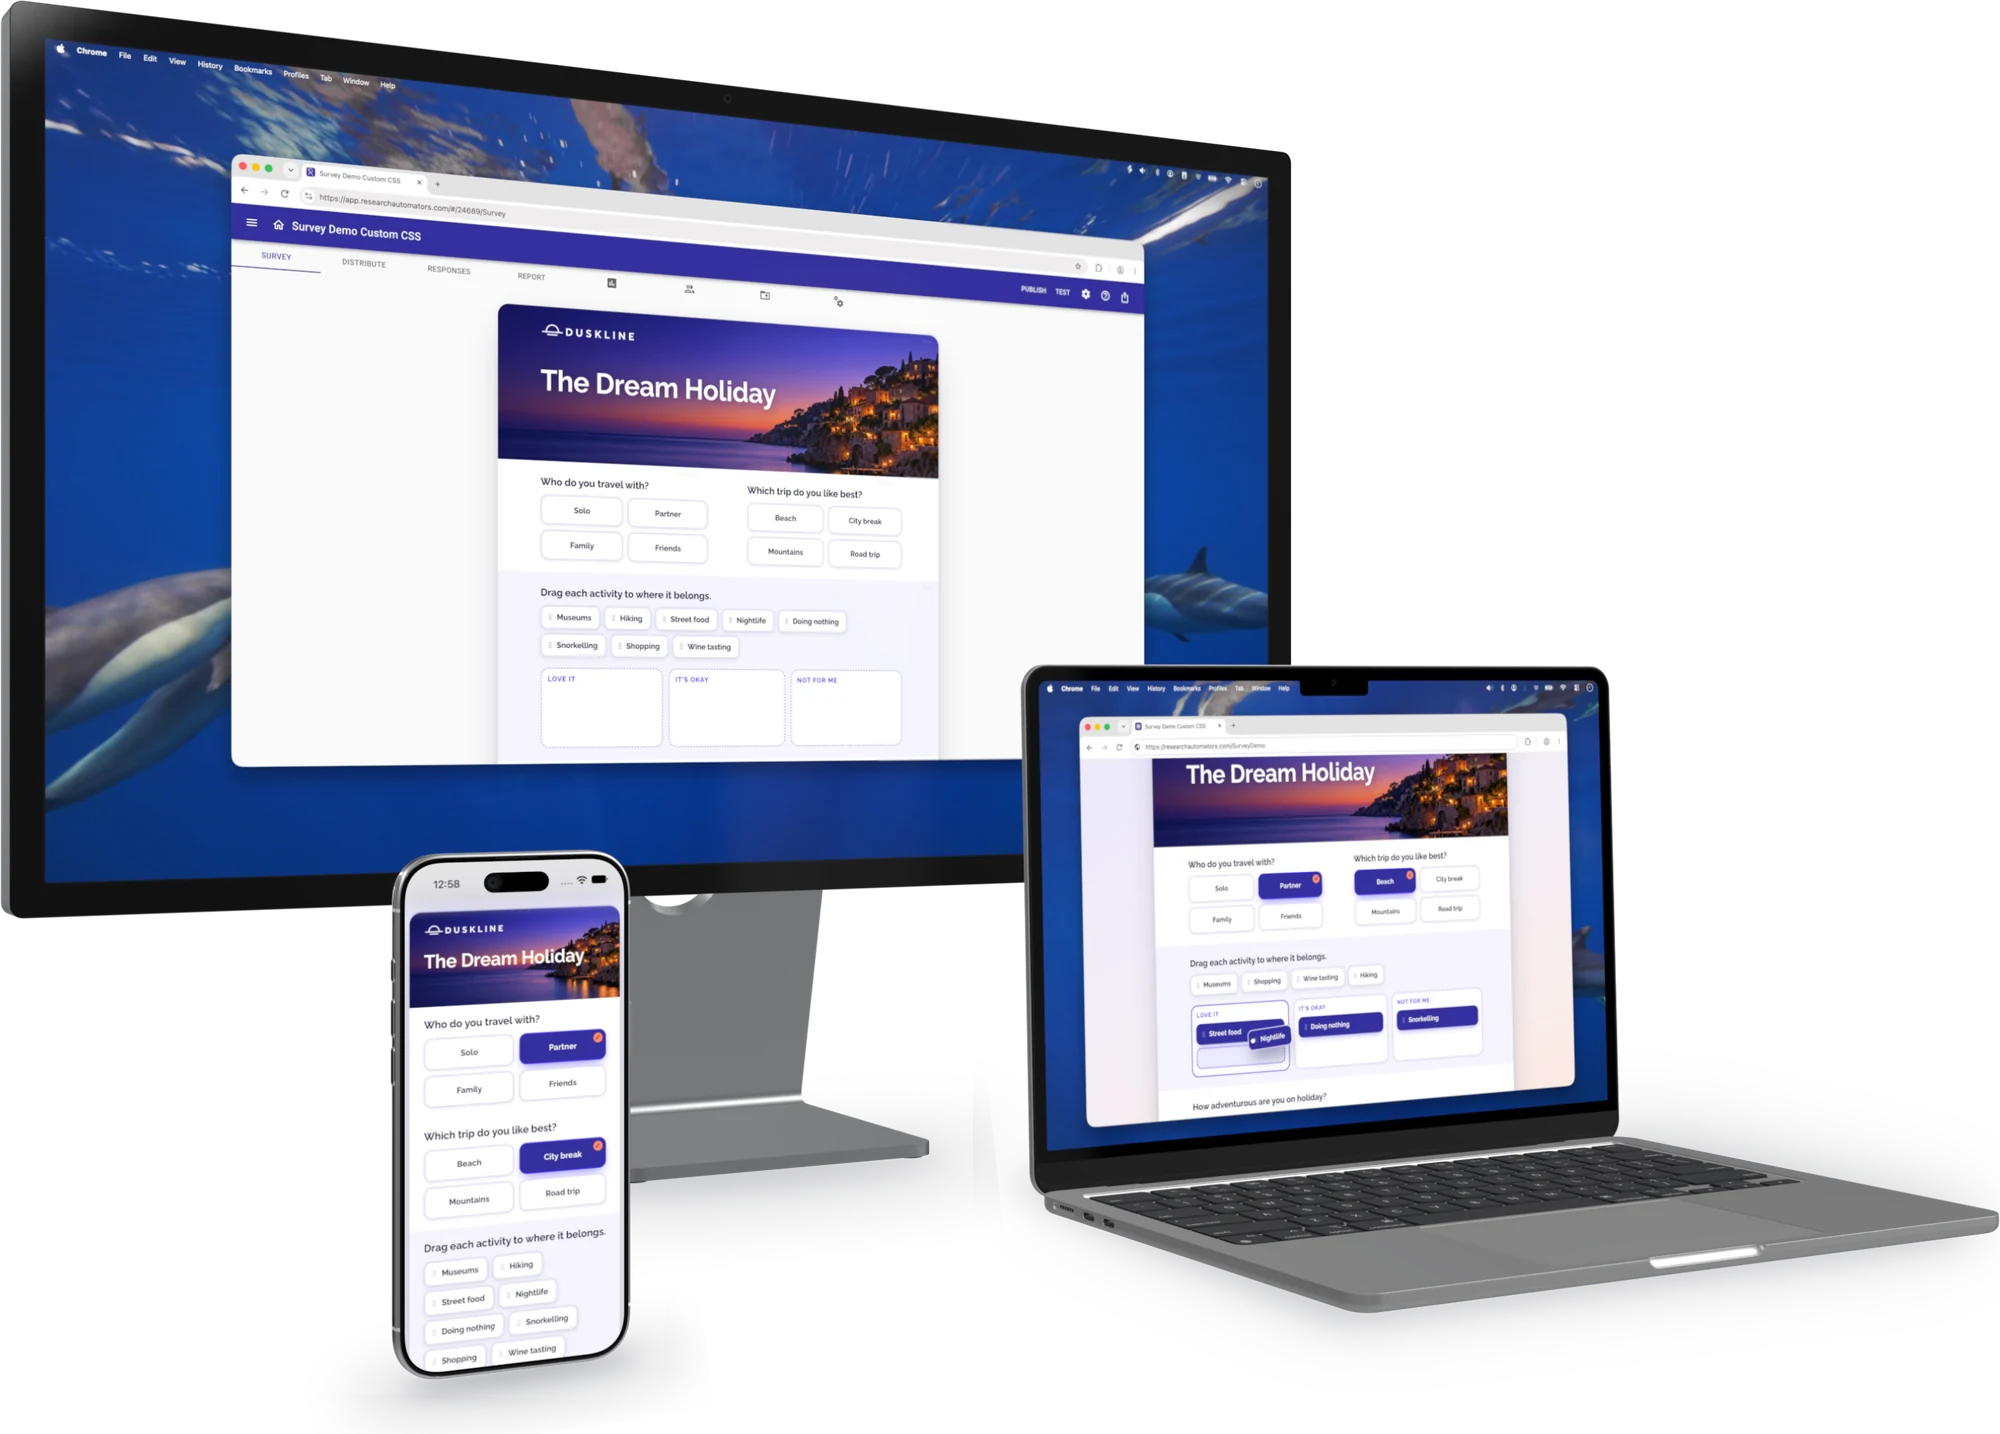
Faster Surveys, Smarter Reports – All in One Platform
Use a survey platform built for...


For Market research agencies and Consultants:
Make every project more profitable
Many research agencies spend too much time on repetitive tasks. Survey scripting, translation, data processing, cross-tabs and chart creation and PowerPoint production often consume valuable analyst hours.
Our platform uses AI and automation to streamline these workflows while preserving your agency's methodology, reporting standards and visual identity.
Less production work. More time for analysis, consulting and client value.

Scale Without Growing Your Team

Transparent Pricing & No Long-Term Lock-Ins

Continuous Efficiency Improvements
For Fieldwork Agencies:
Automated scripting. Simplified revision process
Cut out the email clutter. Your clients can easily review, provide feedback, and make adjustments to survey texts right in the platform.
They can also view response data, download cross-tabs and charts at any time through the dashboard.

AI-Translations



For brand insights managers:
Fully customizable Brand tracking
Do you spend a lot of time on recurring brand tracking reports? Or are you struggling to recreate the same report with unique data for different countries / markets?
As a platform user, we help you automate the path from survey to reports.
Automated reports in your own PowerPoint template

Weekly, monthly, or quarterly reports

Unique reports per country / market
Open-response coding is automated

Visualise as brand funnels, word clouds, coloured tables and more.

For CX / EX Insights Managers:
Customer and employee surveys. Your way
Build fully tailor surveys, dashboards, and reports to your specific CX/EX needs without being locked into generic tools.
We help you streamline the path from survey to dashboards with unique reports per manager or department.

Deliver reports based on an organisational hierarchy
PowerPoint reports in own template
Calculations such as significance, correlation, index, NPS, 0-100 average

Visualisations such as priority matrix, coloured tables, combined graphs & tables, word clouds
For Trade & Industry Organisations:
Your Market Reports. Automated
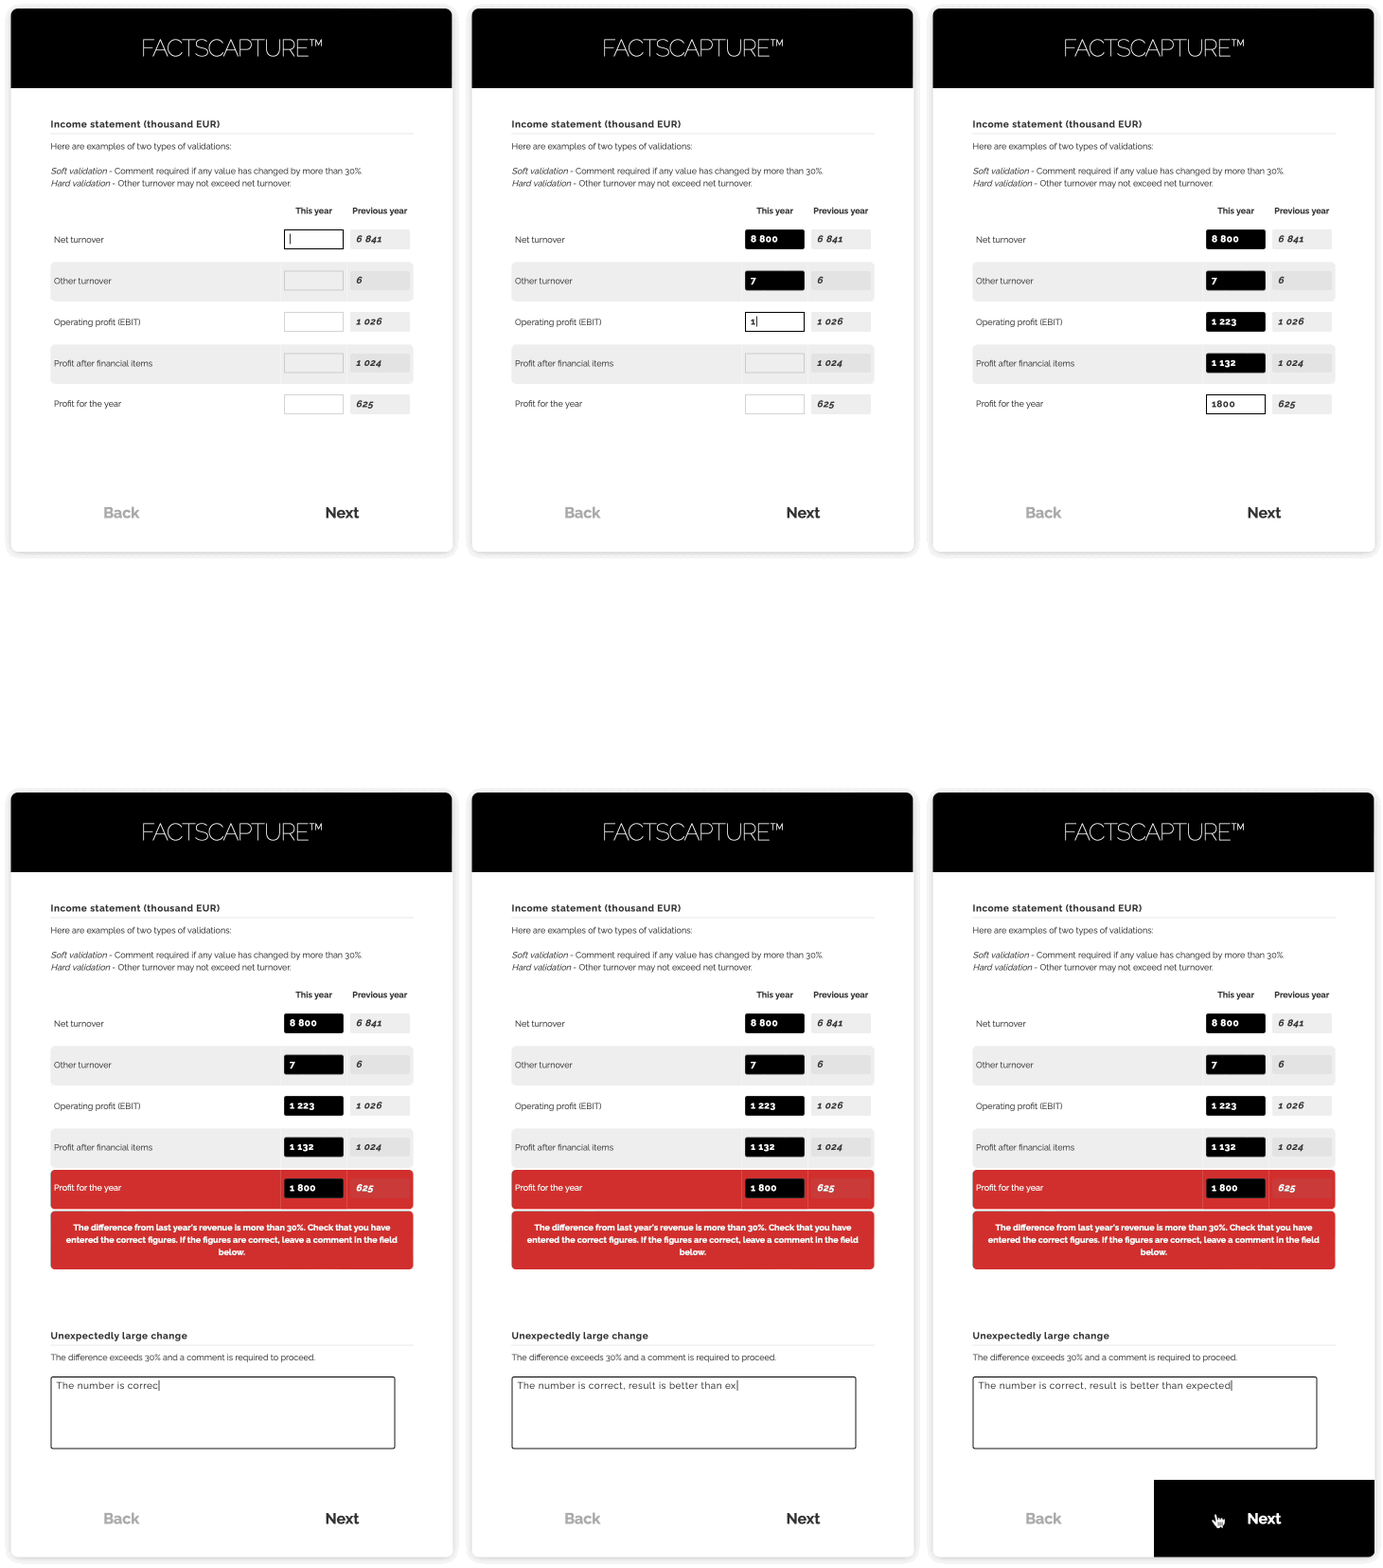
Do your members provide their sector data to you through web forms or Excel files? Ensure data quality and efficiency with our platform.

Data is verified directly as it's entered or uploaded...
...and compared with previous period's data online
Email invites and reminders to data providers are automated

Track development - automated reporting
Save time


Your Reports. Your Style. Fully Automated.
Getting started is easy – our team will help you implement fully automated PowerPoint reporting tailored to your needs.
Curious how your automated reports can look?
Talk about time wasting and automation with us!
Get in touch and we will discuss streamlining the survey process.