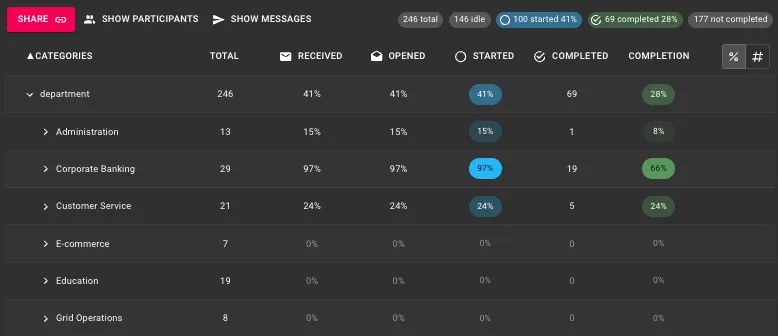
The statistics view shows how far your survey has come, split by your categories. You can see how many respondents have received, opened, started and completed the survey in each department, organization or other group, so you know where to follow up.
Open the statistics view
- Open your project and go to the Distribute tab.
- Click Show statistics. You can switch back at any time with Show participants or Show messages.
What the columns mean
Total The number of respondents in the category.
Received Respondents who have received the survey.
Opened Respondents who have opened the email. See What does Opened mean in email sendouts? for how opens are counted.
Started Respondents who have started the survey. [check: whether this includes those who have completed it]
Completed Respondents who have submitted the survey.
Completion Completed as a share of Total. For example, one department has 71 respondents and 45 completed responses, which gives a completion of 63%.
Read and sort the numbers
- Click the arrow next to a category to see the levels under it, for example Organisation → each company.
- Switch between percentages (%) and counts (#) with the buttons at the top right of the table.
- Click a column heading to sort by it. Sort by Completion to find the groups with the lowest or highest response rate.
- The summary at the top right shows the whole project: total, idle (not started yet), started, completed and not completed.
Example: finding where to follow up
The numbers on a category row are a total for everything under it. A department can show a good completion overall while one team inside it has barely started. So don’t stop at the top level: expand the categories and look at each level below.
- Expand a category, for example department.
- Look at each row and what it tells you:
- High Received but low Completion: the respondents have the survey but haven’t answered. Send a reminder to this group.
- Low or 0% Received: the survey hasn’t reached the group yet. Check your email sendouts first.
- High Completion: the group looks fine at this level, but expand it before you move on.
- Expand the groups under it and repeat. A unit with 2% completion can be hidden inside a department that shows 60% overall.
- Sort by Completion to put the groups with the lowest response rate first.
What you find at the lower levels is often the most useful part. A low response rate in one unit can mean the invitation went to the wrong people, a manager hasn’t passed it on, or a reminder is needed for just that group rather than everyone.
Share the statistics with a client
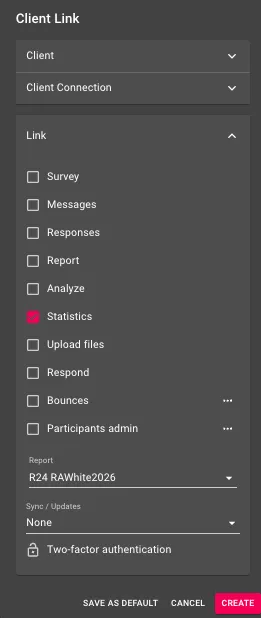
You can give a client their own link to the statistics view, so they can follow the response rate themselves without asking you for updates.
- Click Share at the top left of the statistics view. The Client Link window opens, with Statistics already selected under Link.
- Under Client, choose who the link is for.
- Under Link, add anything else the client should have access to, for example Report or Responses. Leave the rest unchecked.
- Click Create.
The Statistics view can be enabled for existing Clients as well, in the Client-tab.