

What is a category hierarchy?
A category hierarchy is a structured way of organizing categories into parent–child relationships. Each level represents a layer of specificity, for example, Region → Country → Department → Team.
In Survey Automator, hierarchical categories can be used to export as Multiple Reports. By selecting the parent node as the driver variable, you can automatically generate separate reports for all child nodes, each including comparisons to its parent level.
Why use hierarchical categories?
Hierarchical categories make complex reporting manageable. They allow:
- Automatic aggregation of results from lower to higher levels.
- Drill-down navigation in dashboards and reports (e.g., Total → Region → Unit).
- Consistent data alignment across surveys sharing the same organization tree.
Without hierarchical categories, each level must be handled manually which can increase the risk of mismatched data or inconsistent roll-ups.
How are hierarchical categories different from other categories?
Ordinary categories are flat which means each value exists independently. An example of a flat, background variable would be gender or age groups.
Hierarchical categories, by contrast, define a parent–child dependency, where each node “belongs” to a level above it.
For example:
Global
 ├── Region A
 │    ├── Country X
 │    │    ├── Department 1
 │    │    └── Department 2
 │    └── Country Y
 └── Region B
This structure enables multi-level aggregation and filtering in reports, which cannot be achieved with standard (flat) categories.
Here is another example of how a hierarchical category tree could look after Categories has been exported as an Excel-file from the Distribute-tab:
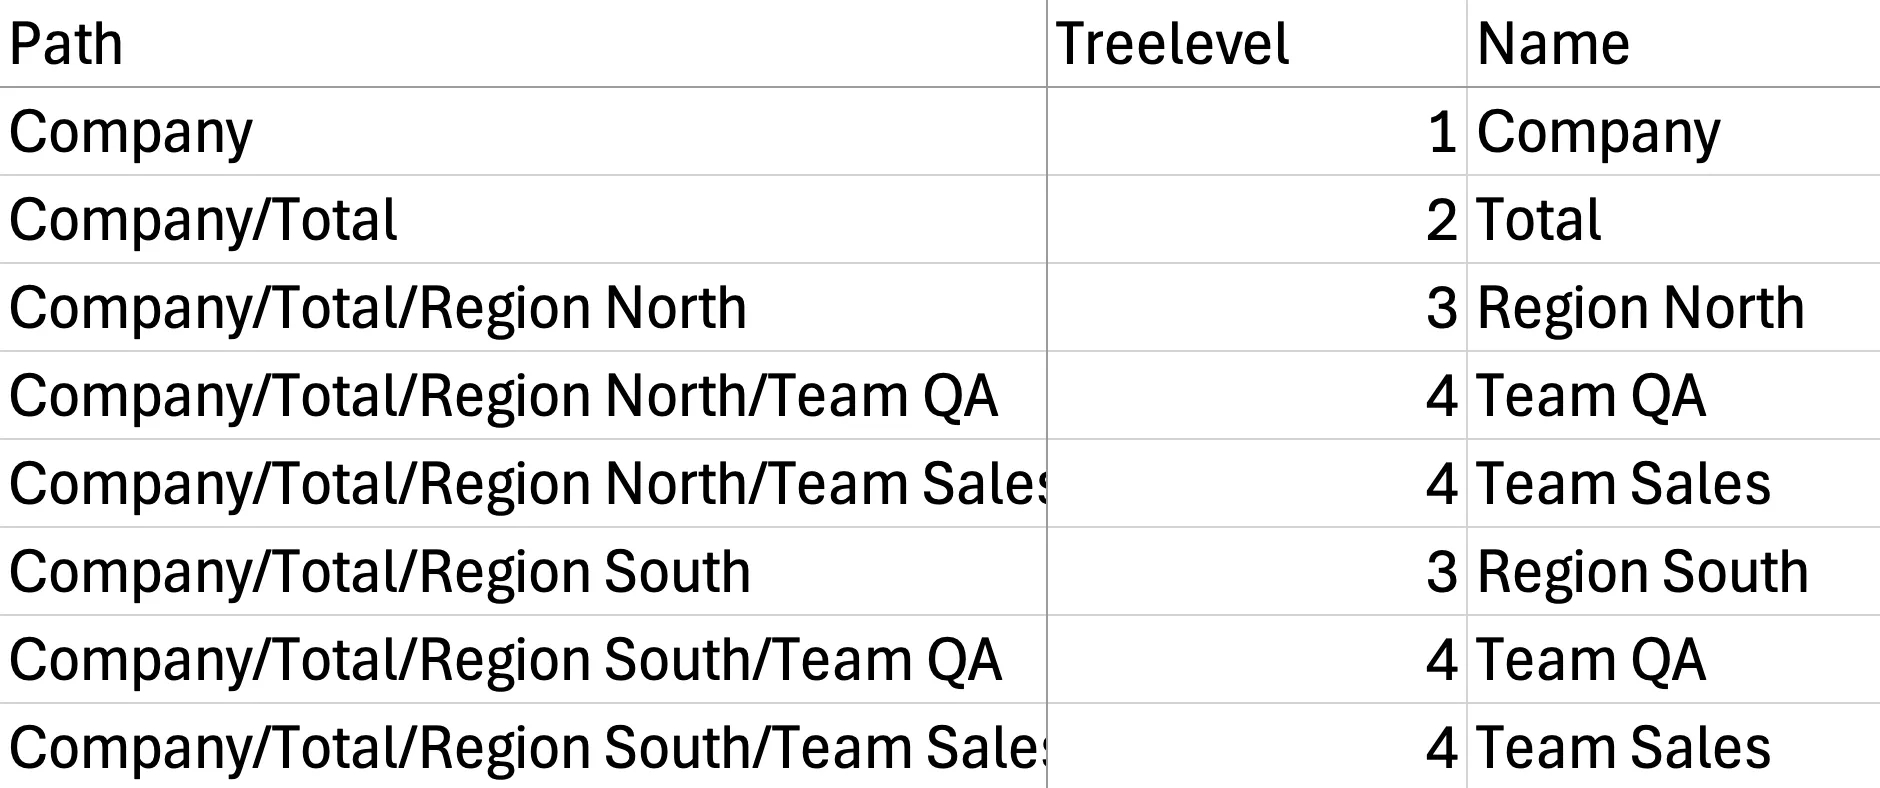
And this is an example of a flat category-tree without a properly working top-node:

Working with multi-level hierarchical reporting
When a project uses a hierarchy, you enable hierarchical reporting per report/dashboard:
- Open your Report or Dashboard.
- Click the cogwheel (⚙) in the top bar and choose Multiple reports.
- Select a Driver variable (your hierarchical category).
- Confirm. The system generates a report “instance” for each node in the hierarchy, letting you navigate level by level (e.g., All → Region → Department → Team).
Important details
- Driver variable = your hierarchy. Pick the hierarchical category that mirrors your org tree.
- Top node required. The hierarchy must have a single top (e.g., “All” / “Company” / “Total”). Without it, totals and roll-ups won’t work, and you can’t base multiple reports on it.
Important: Always use a Top Node
Each hierarchy must include a top node — this acts as the root of the tree.
-
The top node represents the total population (e.g., “Company” or “All respondents”).
-
All child levels (regions, departments, etc.) must branch from this top node.
-
You cannot build multiple reports on the same hierarchy unless it has a defined top node.
Without it, the system cannot aggregate results properly or calculate overall totals.
Tip*:* Use a neutral label like “All” or “Total” as your top node to make it clear in reports.
Steps after setup
Delete unused descendants
After importing or editing your hierarchy:
- Go to the Distribute-tab
- Click on your Category and select Delete Unused Descendants.
- This helps avoid blank report entries and keeps the structure clean.
Not seeing any responses?
If your charts or report pages show empty or zero data:
-
Check the hierarchy connection
Confirm that the category variable used in your respondent data matches the hierarchy codes exactly.
-
Check the Integrity feature
In Report / Dashboard → Cogwheel (⚙) → Integrity, you can define the smallest base required to produce data or reports.
This means you set a minimum number of responses that must be available for a result to be shown in a report or dashboard.